Your ROAS is 4X. Your Meta campaign is green. Your team is celebrating.
And yet — the bank account doesn’t feel right.
This is the return rate problem. And it is the most underestimated profitability killer sitting inside Indian D2C brands right now.
Most founders track ROAS. Very few track what actually makes it to the bank after returns, reverse logistics, restocking, and wasted ad spend on customers who never kept the product.
Let’s fix that.
The Real Math Nobody Shows You
Here’s a scenario that plays out inside dozens of D2C brands every single month:
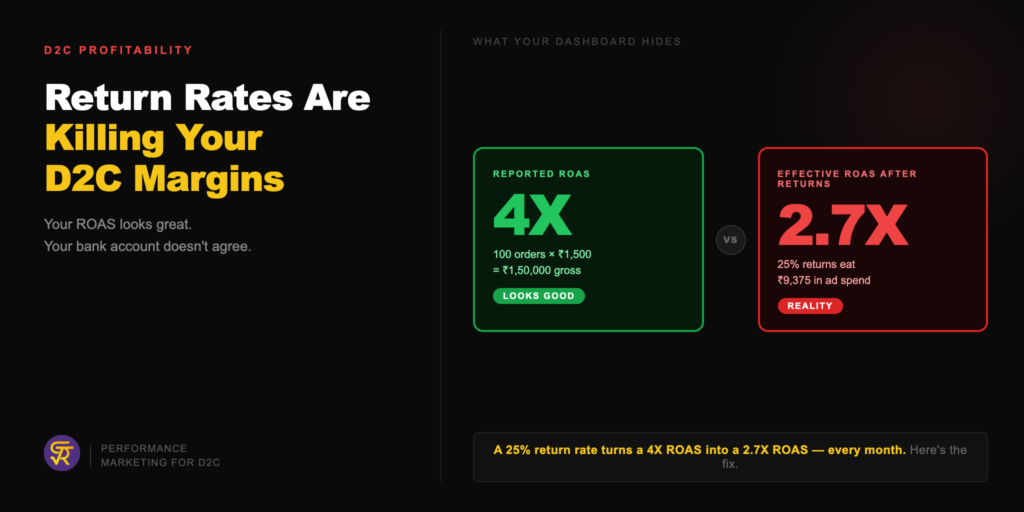
You run a Meta campaign. 100 orders. ₹1,500 average order value. Gross revenue: ₹1,50,000. Reported ROAS: 4X on ₹37,500 ad spend. Your dashboard is celebrating.
Now add returns:
- 25% return rate (standard for fashion/apparel D2C in India): 25 units come back
- Forward shipping for 100 orders: ₹9,000
- Reverse logistics for 25 returns: ₹4,500
- Restocking + quality check: ₹2,500
- Payment gateway on returned orders: ₹750 (charges are rarely reversed)
- Ad spend wasted on 25 buyers who returned: ₹9,375
Effective net revenue: ₹1,12,500.
Effective ad spend recovered: ₹28,125 (only for the 75 who kept the product).
Effective ROAS: 2.7X — not 4X.
That ₹9,375 in ad spend? Gone. You paid to acquire 25 customers who sent the product back.
At scale — say ₹10 lakh/month in ad spend — a 25% return rate is bleeding ₹2.5 lakh worth of acquisition budget every single month on buyers who give you nothing.
Revenue grows. Returns grow with it. Profits don’t.
Why This Is a Marketing Problem, Not a Logistics Problem
Here’s the uncomfortable truth that most D2C founders miss: returns are not fixed in the warehouse. They are fixed inside the ad funnel.
The typical response to rising returns is operational — better packaging, faster shipping, stricter quality control. All of that matters. But 60–70% of the reasons customers return products are set before they even click “Buy Now.”
Your ad made a promise. If the product doesn’t keep that promise — in size, colour, texture, use case, or expectation — the return is already guaranteed.
The ad is where the problem starts. The ad is where you fix it.
The 5 Return Triggers Hiding in Your Ad Funnel
1. Visual Misrepresentation — Colour and Texture Don’t Match Real Life
The number one return reason in apparel D2C: “colour was different from photos.”
Studio lighting makes navy look royal blue. Phone screens make matte fabric look glossy. If your ad creative is shot under studio lights with heavy post-processing, you are creating a return before the order ships.
The fix: Shoot creatives in natural light. Show texture close-ups in video ads. Include a colour accuracy note in your product description — it sounds defensive but it reduces complaints significantly.
2. Size Ambiguity — “Model is 5’8 Wearing a Medium” Isn’t Enough
You put the model’s height and size in the caption. Fine. But your buyer is 5’3 and a large. She cannot visualise what that garment looks like on her body.
Brands that reduced return rates by 15–20% did one thing differently: they showed multiple body types wearing the same product in their ads. Not for diversity optics. For practical sizing reference.
3. Impulse Buyers — The Wrong Traffic Source
Not all Meta traffic is equal. Broad audience campaigns at low CPMs often pull in high-impulse, low-intent buyers — people who clicked because the creative was compelling, not because they needed the product.
These buyers return at 2X the rate of retargeting audiences and repeat customers.
Effective ROAS isn’t the same as reported ROAS. A campaign with a 3.5X ROAS but a 10% return rate is worth more than a campaign showing 4.5X ROAS with a 28% return rate. Most dashboards don’t show you that split.
4. Comparison Buyers — They Ordered From Three Brands
Especially in categories like ethnic wear, sneakers, and supplements: the buyer orders from you and two competitors, tries all three, keeps one, and returns the other two.
You cannot stop this behaviour. But you can identify these buyers in your Shopify data — multiple orders, high return rate, multiple brand touchpoints — and suppress them from future acquisition campaigns.
5. Gift Buyers Without a Clear Brief
Gifting-intent buyers — especially prominent during festive seasons — buy without knowing the recipient’s preferences precisely. Diwali, Raksha Bandhan, birthdays. The gift recipient doesn’t want it or it doesn’t fit. It comes back.
The fix here is post-purchase, not pre-purchase. A “this is a gift” checkbox at checkout that triggers a gift-recipient-friendly exchange flow reduces returns by removing anxiety — and paradoxically, easier returns lead to fewer returns.
Fix Your Ad Creatives First — The Highest-Leverage Move
If you do one thing after reading this, audit your top 10 performing ad creatives against your return data by SKU.
Pull your Shopify returns report. Match it to campaign and product. You will almost certainly find that 2–3 specific products — and 2–3 specific creatives — are generating 60–70% of your total returns.
Replace those creatives. Prioritise:
- UGC-style video ads over studio photography — real customers in real lighting with real bodies set accurate expectations
- Size-on-body demonstrations — a 15-second Reel showing the product on a real person is worth more than any lifestyle shoot
- Honest copy — “structured fit, runs slightly large” in the ad itself. Buyers who know this don’t return it for being “too big”
Fix Your Audience Targeting Second
Meta’s algorithm optimises for purchases. It does not know which purchases stayed. You have to teach it.
Build a “low-return buyer” custom audience:
- Export your Shopify orders from the last 6 months
- Cross-reference with return data — identify buyers who ordered and kept
- Upload this as a custom audience to Meta
- Build a lookalike from this segment — not from all buyers
A lookalike of your best-keeping customers will naturally have a lower return rate than a lookalike of all buyers. The difference is measurable within 30–45 days of running both in parallel.
On Google, the same logic applies to Customer Match lists. If you run Performance Max, feed it your high-LTV, low-return buyers — not your full customer list.
The Post-Purchase Sequence That Reduces Buyer’s Remorse
Buyer’s remorse peaks in the 48 hours after purchase, before the product even arrives. This is where a WhatsApp or email sequence earns its ROI.
Message 1 (immediately after order): Order confirmation + “Here’s how we packed yours” — behind-the-scenes content that turns a transactional confirmation into a brand moment.
Message 2 (24 hours after dispatch): “Your [product] is on its way — here’s how to get the best out of it.” Link to a styling guide, usage video, or size fit guide. You are pre-empting the “it doesn’t look right” reaction before it forms.
Message 3 (day of delivery): “Just arrived? Here’s how our exchange works if you need it.” Proactive, easy exchange positioning. Counter-intuitively, making the process easy and transparent reduces the number of people who use it — it removes the anxiety of being stuck with a wrong purchase.
These three messages take 2 hours to set up in Klaviyo, WebEngage, or WhatsApp Business API. The return rate reduction pays for itself inside one festive season.
The Return Rate Dashboard You Should Build Right Now
You cannot fix what you don’t measure. Add these four metrics to your weekly performance review:
| Metric | What It Tells You |
|---|---|
| Return rate by traffic source (Meta / Google / organic) | Which acquisition channel sends the highest-return buyers |
| Return rate by ad campaign / creative | Which specific creative is setting false expectations |
| Return rate by product category | Which SKUs have a product-description mismatch problem |
| Effective ROAS (factoring in returns) | What your campaigns actually delivered to the P&L |
Most Shopify dashboards don’t surface this automatically. Use Shopify Analytics + your ad platform’s order value reporting + a simple Google Sheet with a returns column. If you use Loop Returns or Returnly, both platforms export return-reason data you can map directly to campaigns.
What a 5% Reduction in Return Rate Is Worth
If you spend ₹10 lakh per month on performance marketing and your current return rate is 22%:
- 22% returns = ₹2.2L of ad spend acquiring customers who returned
- Drop to 17% = ₹1.7L wasted
- Freed up: ₹50,000/month in effective ad budget — without spending a rupee more
At ₹50L/month in spend, that same 5% improvement is ₹2.5 lakh per month recovered. Every month. That is not a logistics problem. That is a marketing opportunity.
Frequently Asked Questions
What is a good return rate for D2C fashion brands in India?
The benchmark for apparel D2C in India sits between 12–18%. Brands below 12% typically have strong UGC creative, accurate product descriptions, and a healthy retargeting-to-prospecting ratio. Anything above 25% consistently points to a creative or targeting mismatch.
How do return rates affect ROAS?
Directly. Your platform ROAS is calculated on gross order value — it counts the sale whether or not the product was returned. Effective ROAS net of returns can be 20–40% lower than your dashboard shows, depending on your return rate.
Can I blacklist high-return customers from my ads?
Yes. In Meta, upload a customer list as a suppression audience. In Google, exclude a Customer Match list from campaigns. This is legal and common practice. Loop Returns and Returnly both allow you to flag serial returner profiles for export and suppression.
Does offering free returns increase return rates?
Yes — free returns increase return rate by 5–10 percentage points on average. However, they also increase conversion rate and average order value. The net impact depends on your category and margin. For low-margin apparel at high volumes, free returns usually destroy profitability.
How quickly can I see results after fixing ad creatives for returns?
Typically 3–4 weeks. Returns from existing shipped orders continue for 7–14 days post-fix. New orders from improved creatives will show lower return rates within 2 weeks of delivery.
If your D2C brand is seeing strong ROAS numbers that aren’t showing up in your bank account, return rates are the most common culprit — and it’s solvable at the marketing layer. At Sqroot, we audit acquisition campaigns against return and profitability data to find exactly where margin is leaking. Book a free performance audit and we’ll show you the number.
