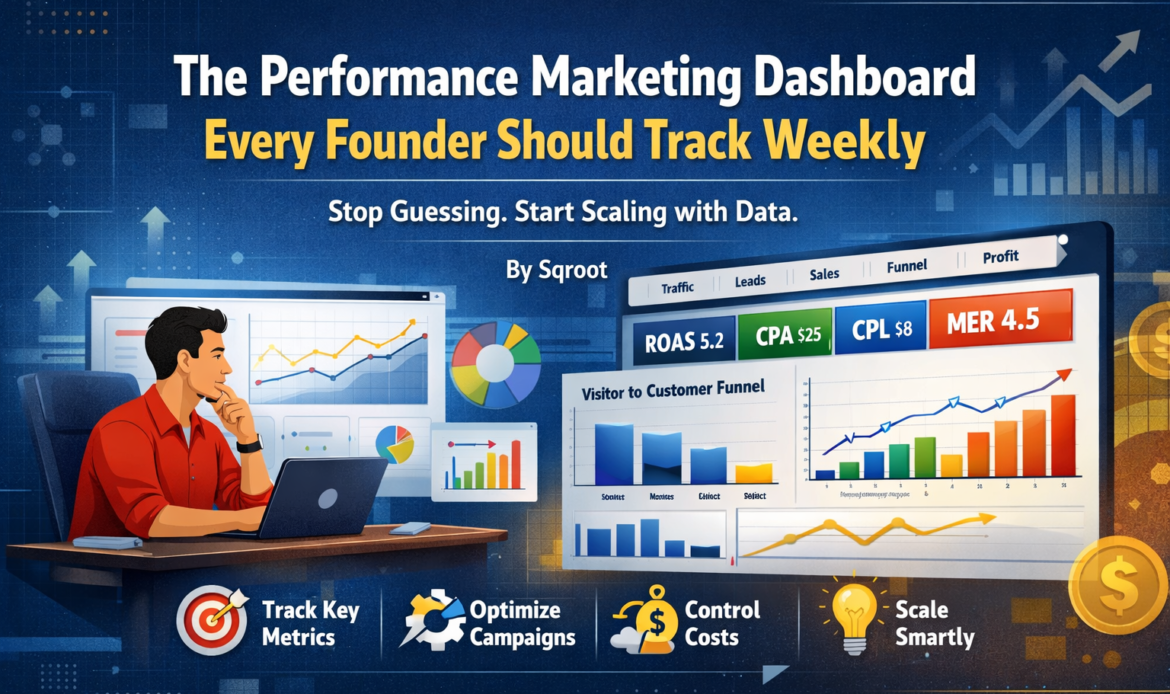
The Performance Marketing Dashboard Every Founder Should Track Weekly
Why Most Founders Struggle with Marketing
Most founders look at marketing like this:
How many leads did we get?
How much did we spend?
But high-growth companies don’t scale using surface-level metrics.
They scale with clarity, consistency, and control over numbers.
At Sqroot, after working with D2C and lead-gen businesses, we’ve seen a clear pattern:
Founders who track the right metrics → grow faster
Founders who don’t → burn money
Why You Need a Weekly Marketing Dashboard
Daily data = too noisy
Monthly data = too late
Weekly tracking = perfect balance
It helps you:
Identify problems early
Optimize campaigns faster
Control CAC & profitability
Make data-driven decisions
The 5 Pillars of a Performance Marketing Dashboard
Your dashboard should not be random metrics.
It should be structured into 5 core pillars:
1. Traffic Metrics (Audience Quality)
If traffic quality is wrong, nothing else matters.
Track:
Website visitors
Traffic by channel (Meta, Google, Organic)
CPC (Cost Per Click)
CTR (Click Through Rate)
Insights:
High CTR → strong creatives
Low CPC → efficient ads
Balanced channels → stability
2. Lead & Conversion Metrics
Traffic without action = wasted money.
Track:
Conversion Rate (%)
Cost Per Lead (CPL)
Leads by source
Landing page conversion rate
Benchmark:
2–5% conversion (industry dependent)
3. Sales Metrics (Revenue Clarity)
This is where most founders lose visibility.
Track:
Total sales
Revenue
CPA (Cost Per Acquisition)
ROAS (Return on Ad Spend)
Important: High ROAS ≠ Profit always
4. Funnel Metrics (Hidden Goldmine)
Most ignored. Most powerful.
Track:
Add to Cart %
Checkout %
Purchase %
Drop-offs
Example:
1000 visitors
100 add to cart
30 checkout
10 purchases
Where did you lose 990 people?
5. Profitability Metrics (Real Growth)
This is where real founders operate.
Track:
CAC (Customer Acquisition Cost)
LTV (Lifetime Value)
MER (Marketing Efficiency Ratio)
What matters:
LTV > CAC → scalable business
MER → true performance indicator
Ideal Weekly Dashboard Structure
Overview
Total spend
Total revenue
ROAS
MER
Traffic
Visitors
CPC
CTR
Channel split
Leads
Total leads
CPL
Conversion rate
Sales
Orders
CPA
Revenue
Funnel
Add to cart %
Checkout %
Purchase %
Common Mistakes Founders Make
At Sqroot, we see this repeatedly:
Tracking vanity metrics
(Likes, impressions don’t pay bills)
Ignoring funnel leaks
(You don’t fix where you lose money)
Not connecting marketing with revenue
Inconsistent tracking
How to Use This Dashboard
Tracking alone isn’t enough.
Every week, ask:
Which channel is most profitable?
Where is the biggest drop in funnel?
Is CAC increasing or decreasing?
Are we scaling profitably?
Sqroot’s Founder Framework
We simplify marketing into 3 stages:
1. Acquire
→ Traffic + Leads
2. Convert
→ Funnel + Sales
3. Scale
→ Profitability + Retention
Final Thoughts
You don’t scale with more ads.
You scale with better decisions.
And better decisions come from:
✔ The right data
✔ Consistent tracking
✔ Correct interpretation
Want to Build a Data-Driven Growth Engine?
At Sqroot, we help businesses build predictable, scalable, profitable marketing systems.
Let’s turn your data into growth.
